

Report and final blog Femke
Report and final blog Femke
The end of the field project is there, we are back in the Netherlands now. We brought all measurement equipment back home, with exception of the weather and soil moisture station. These stations are still in Kuku and packed with solar panels, so at the beginning I was a bit reluctant to let them stand there. But Justes – the guy who supervises the semi-circular bunds constructors – told the Maasai that the stations have a built-in computer and as soon as you touch it, a pic of your face is sent to the head office. How brilliant is that! The weather and soil moisture stations update data every 15 minutes to the GSM network, where after the data is transferred to the internet. So every 15 minutes we can see the current weather and soil characteristics of Kuku, here in the Netherlands! How cool is that?

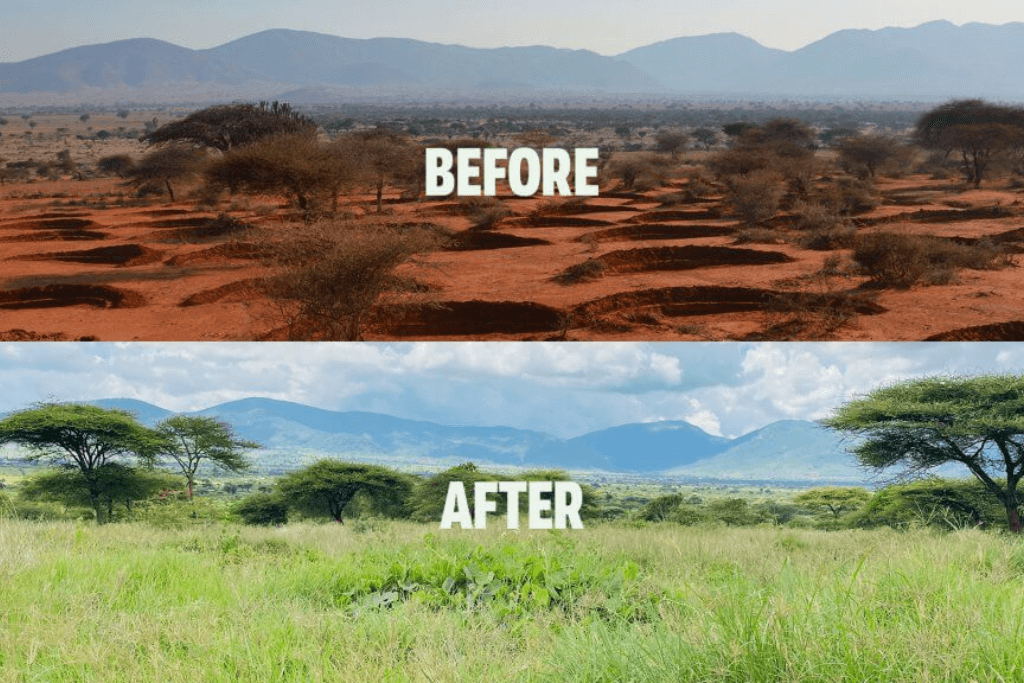
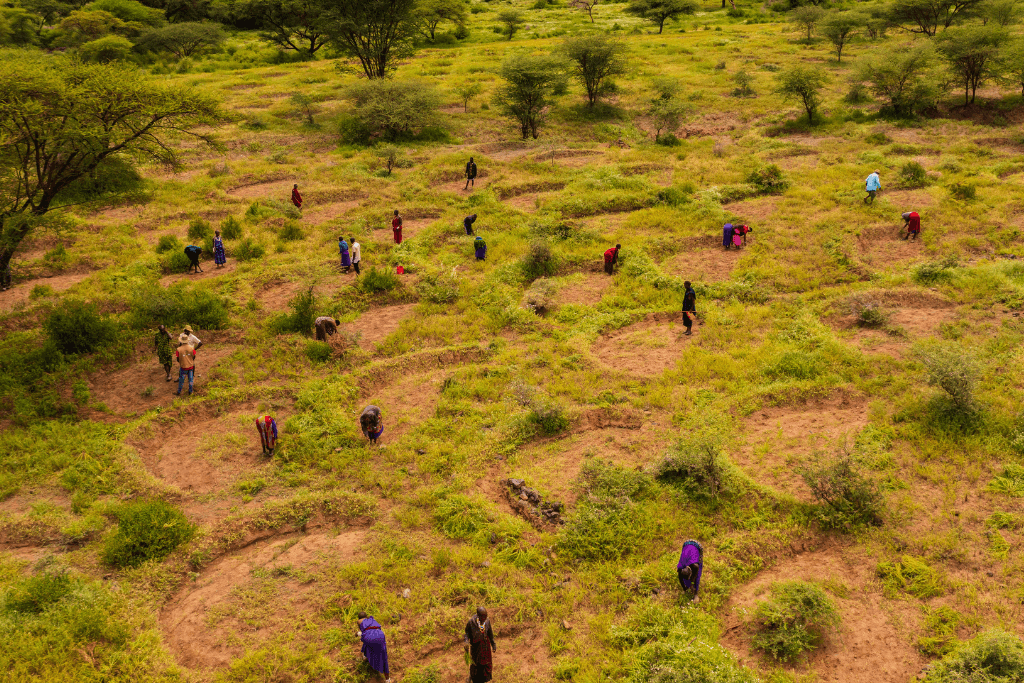
What I most remember from Kuku is the rapid change from an arid dry sand pit to a green oasis. And then when no rain falls, back again to withered vegetation. To be quite honest, I was sceptic at the beginning of the project. The landscape is nevertheless heavily affected by this project. But after analyzing the area for three months, I have been amazed! Already after one month the effect of the bunds on soil moisture and infiltration rate was visible. But the most striking thing I found was the vegetation cover that was much higher in my study after the rain season compared to my reference area. The figure above shows the vegetation cover, before and after the rain season made in ArcMap. The upper plots represent the study area with the bunds and the lower plots show the reference area. As you can see, the vegetation cover has considerably increased in the area with the bunds, whereas the growth of vegetation is stagnated in the area without bunds. That a relatively small adjustment, already has thís impact after such a short period: I think that is amazing!
Read all my findings in the report!